Cloudy

Cloudy days and Sunny days.
Cloudy days and Sunny days.
For my fellow networking nerds – Great description of the complexity of flow control. It is interesting to see how BBR does in the presence of other methods (CUBIC, Vegas, Reno, etc). Of course in the Linux world the TCP FC algorithms are in a state of constant tweakness, so in a given network there are probably sample of all of them running.
https://blog.apnic.net/2017/05/09/bbr-new-kid-tcp-block/


I posted a few tidbits about some data from a small log a week back, and Lance Lucas suggested I dig a little deeper using the compressor wheel speed sensor. I wired it up to my DAQ device and did a few quick pulls to see how the data looked. Data is from my 2008 STI, EFR8374 turbo with T3 .82 housing, Cosworth cams and heads, E85 fuel, ID2000s, Perrin headers, up an down pipes, and intercooler.
This is just a quick and dirty look at the data, but interesting none the less.
Attached are 10 graphs from that effort
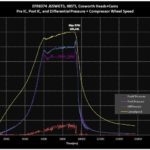
Graph 1 – Wastegate Boost, so no WGDC. You can see post IC pressure is between 17-18psi, with a bit of a dip in the midrange. Compressor wheel speed is pretty flat, but ramps a tad at the end which looks a bit of creep. I cranked the waste gate down quite a bit, so I’m not too surprised. This is an internal waste gate with a simple three port solenoid, so it will be interesting to see how it does at higher pressure. Peak RPM of 89,240 is pretty low on the compressor map.
Graph 2 – Same run as above, but looking at temperatures. At such a low boost level the intercooler is almost a perfect conversion. Efficiency is near 99%, and stays there the entire pull. With a peak input to the intercooler of 185F, but a peak output of 62F, you can hardly tell the air is heated. This is primarily the result of a very larger intercooler for the size and flow of the engine. There is a great deal of thermal mass in that intercooler, and it was very cool out (58 degrees). This is third gear, so at the end airspeed over the intercooler is >80mph.
Graph 3 – The cost of such a larger intercooler – Pressure drop across the core is low at the beginning, but ramps up to about 2.5psi at redline. This isn’t terrible given the size of the core. It is generally said that the cause of the pressure drop is the mechanical restrictions of the intercooler (for example the internal surface area, air flow changes, etc, but I suspect that while the system is considered isobaric (constant pressure), the losses across the intercooler indicates while the system is open the behavior would probably be better modeled with an PDE approach. I need to noodle on that some to see if I am even remotely correct.
Graph 4 – I thought it would be interesting to look at the change in speed of the compressor on a throttle lift. I was not sure how fast the compressor would decelerate, and 700ms to reach half of the speed seems intuitively reasonable. You can see the oscillations both pre and post intercooler as a results of the diverter valve opening and the pressure wave bouncing back and forth. With a bit more data I’ll do some better analysis, perhaps looking at the differential of the wheel speed to see how it accelerates and decelerates.
Graph 5 – Turn the boost up just a tad. I set the target at 26psi (manifold pressure), which resulted in pre intercooler pressures going from 28 to 30psi. Compressor wheel speed peaked at 105,241 rpm, which is about midway in the compressor chart. Boost control sucks, entirely the result of me having a tad too much on spool followed by some poorly chosen PID constants.
Graph 6 – Temperature for the previous run. Going from 19psi to 26psi raised air temp from 185 to 246F. With the EFR7670 I had previously at the same boost level air temps were over 300F. Air temp after the intercooler bumped up a bit, from a starting temp of about 60F to 70F. Overall efficiency was still in the high to mid 90s. This was a single pull with plenty of cool down around it, but next analysis I will try to do more steady state testing.
Graph 7 – Pressure drop across the intercooler, waste gate compared to 26psi target. More flow, more pressure drop. This is a good demonstration that you can’t use a single ‘drop’ value when looking at compressor maps. I would be curious to see what physical properties are related to the slope of this curve. Both runs show a dip to negative drop, which I suspect is some kind of pressure wave effect.. Something else to dig into!
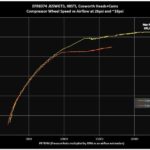
Graph 8 – I was curious how the compressor wheel speed compared to the actual airflow, so I graphed it against the pressure ratio across the turbo multiplied by the engine rpm as an analog to the airflow. During the spool region the wheel speeds follow pretty close, and as you would expect at the higher boost level the wheel speed is higher. The slope of the upper flat portion is what interests me. I was surprised the slope was so low given the significant change in actual airflow. That slope should be directly related to the inverse of the shaft speed slope on the compressor map, as a fixed pressure and a flat speed would translate to the same here.
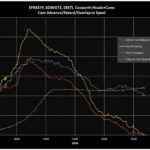
Graph 9 – Spool is significantly effected by the use of valve overlap, so I graphed the intake cam advance, the exhaust cam retard, and the effective value overlap. You can see the overlap, but without more data it is hard to tell how much it helps. I need to change the shape of that curve and see how it changes the spool characteristics.
Graph 10 – A simple look at three different boost curves and the corresponding wheel speeds. More boost, more speed, more go.
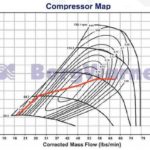
Last up is the compressor map for this turbo, which a red line a rough guess of the path of this engine at 26psi. Since I am not directly measuring air flow I used the compressor speed and pressure ratio. It would be possible to back calculate the estimated airflow and see what kind of real VE I am getting, and I’ll do that next time.
I have a few more graphs, but they need a tad more thought. Some of the data in the graphs came from my prototype DAQ, and some from the access port logging (from the factory ECU). Correlation was manual, but pretty easy. Sample rate was 50hz for the DAQ stuff, and about 15hz for the ECU stuff. Fun stuff to play with. I have more work to do to get the rest of the stuff logging, as I have pressure and temp pre turbine, post turbine, as well as pre compressor.
Thanks to people like Paul Yaw and Tony Palo for the encouragement of data driven discussions.
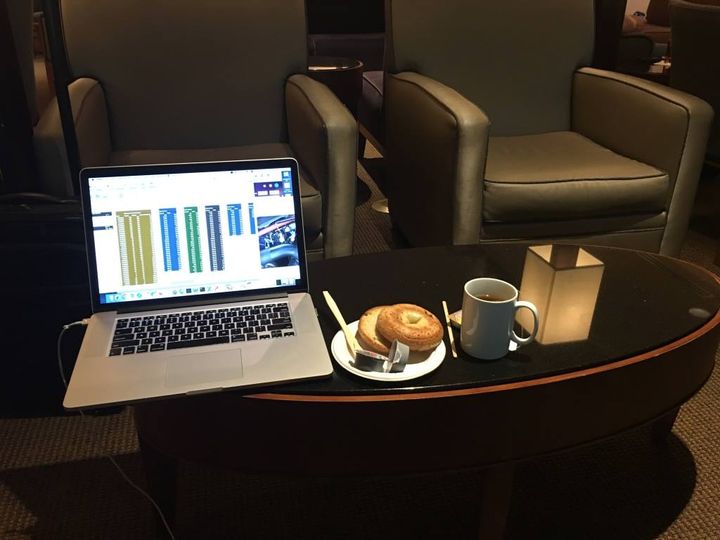
Off for another week in Minneapolis. At least I am flying Delta, so no need for head gear or first aid kit. See you in MSP Vareck Bostrom.
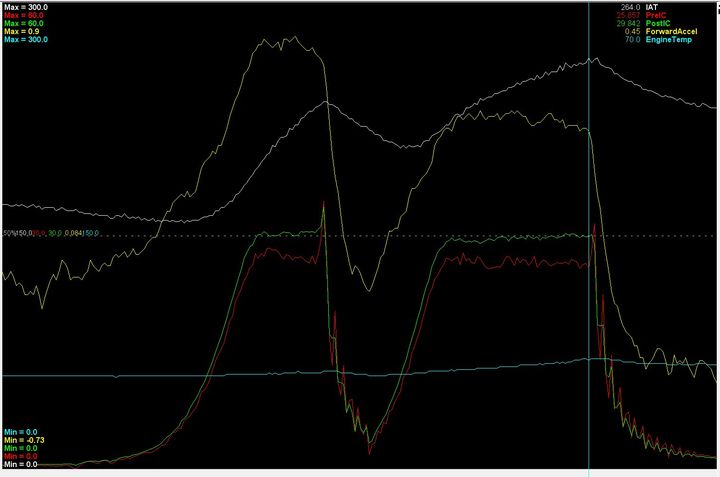
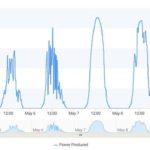
It is surprising what can be seen in a single simple graph, and what questions it can lead to. Look at the attached picture, a simple graph from a simple tool. It shows an acceleration in 2nd and 3rd gear on my drive to work today. The blue line near the bottom is the air temperature after the intercooler. The white line is the temperature before the intercooler and right after the turbo. The red line is pressure after the intercooler, right before the throttle body, and the green is the pressure right at the turbo outlet. Finally the yellow line is the cars acceleration in g’s.
From the start, the contrast from the white to the blue line shows the extreme effect of an intercooler. Life without an intercooler would be a different, more disappointing life. At 264 degrees F the air is cooled to 70F before heading to the engine. Thermodynamics is a wonderful thing.
The red and green lines shows the difference between what the turbocharger is producing, and what is making it to the engine. That is an almost 4psi difference across the intercooler, and some of that change in pressure is the result of the significant cooling imparted on the air by the intercooler. You can see the downward slope of the red line as the temperature differential increases.
The end of each gear has a few interesting properties. You can see the effect of the closing of the throttle by the nearly 6 psi spike right before the throttle plate as it is closed. The slope of both the red and green lines right after that point are almost perfectly aligned. This is with a system of piping and intercooling measuring in the feet, yet the latency is nearly zero. On the downslope you can see the oscillations caused by air bouncing off the throttle plate and reflecting back to the intercooler, and perhaps even back to the compressor cover. If you took that little section of the graph and did an FFT you could measure the frequency of that oscillations and correlate it to the size and temperature of the tubing.
My shifting clearing sucks, as you can see the car actually slows down between shifts. Acceleration in 2nd is higher than in 3rd, and that ratio will be close to the actual gear ratio difference, plus the effects of drag. The shape of the yellow curves are a proxy for the shape of the torque curve of the engine, and you can see the slight fallloff at higher rpm.
The noise is something else to be investigated. Are those pressure variations real? If I overlayed the duty cycle of the wastegate, would they have an obvious interaction?
Lots of questions you can ask yourself, and lots of things to learn to explain something as simple as just a few lines.


Since I need a ton of air temp sensors in my GTR build, I’m taking a crack at making my own using a very fast response bead NTC element. Tony Palo already makes a really kick ass one that uses a TDK glass bead NTC element that has a ‘still air’ thermal response time of ~3s. That constant is an indication of the time to cool 63.2% of the way from a chosen heating point to ambient air temperature in still air. In fast moving air the response time would be much much faster, and in a liquid even more so.
I built these two test units using a similar NTC sensor from Cantherm that has a similar response time but slightly lower thermal mass. Since I have two ports in my Pre IC pipe I can directly compare both of these to not only a GM AIT, but also a low mass thermocouple. I also have a couple of other glass diode elements to try out.
For reference, the thermal response time of the typical ‘fast response’ GM AIT sensor is on the order of 15s. Both of these types of NTC sensors are of the fastest available in that form factor. An exposed tip thermocouple can have a response time as low as 1s in still air, and .01s in liquids, but the accuracy can be as low as +/- 5C.
I used a 3M epoxy potting compound to put the sensor inside a small 1/8NPT to hose adapter along with some Tefzel wire. I made these probes stick out a little bit more than normal because of the location of the adapter I need to use them in. I’ll post up data in a few days as to how they compare.
If you are looking to buy something to put in your build, just get the ones from T1. If you want to experiment with getting that extra 1%, follow along. 😉
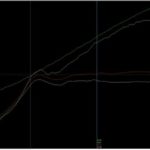


This EFR8374 is not a bad turbo for an STI. Given the size compared to the 7670, the spool is pretty good. In 3rd gear, over 25psi at 4150rpm, 16psi at 3500rpm. First graph has Pre Intercooler(RED) and Post Intercooler(WHITE) pressure, as well as Exhaust Backpressure(Yellow) and RPM (Green).
Second graph is a scatter over a drive, and you can see a 4th gear pull does even better with 25psi at 3780rpm. That is fantastic for a 79lb/min turbo.
The biggest gain in spool during calibration came from lots of intake cam advance and exhaust cam retard.

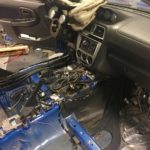

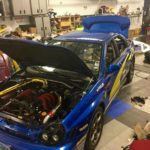


Time for some safety upgrades on the bugeye. New roll cage, seats, harnesses, fire system, nets, HANS. Next up is new sleeved engine and *edit* a GTX3582R Twinscroll turbo. Turbo Flat 6 is good. 15 years old and 15k miles.. hmm..


Cornell Rd now open thanks to Eric Rosenberry and Eric Bryant and a few other helpful motorists!
