Hordes

Ready for hordes.
Ready for hordes.


Related to my previous post, here are a few graphs related to solar energy production over the last 4 year. Most of this data is from my old system in the house I sold last year. It was a 10.8kw system using 34 320w panels. The new system just installed on the new house is a 53 panel 380W system with 20.2kw TAP.
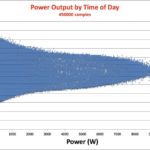
The power output by time of day is interesting in that it clearly shows the effects of angle of the sun. Peak power across all 4 years tends to happen around 1pm, but part of that is certainly due to the particular orientation of the panel system.
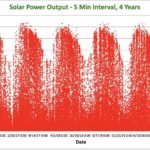
The red graph of power output (not total energy) is interesting in showing how cloudy a complete day was. During some of the winter weeks power output never grew above 2k, while in other spring and fall days you see the average being pretty low but lots of occasional higher power intervals. The summer peaks are very obvious.
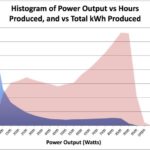
The Histogram of power output is the result of making a histogram the 5 min power averages into buckets (500w wide). The blue shows the number of hours the system operating in that range (excluding the 0 range). Most number of hours in the 0-500 range which would be very cloudy segments, and pretty flat relative values for parts above 3000w. The second pink area shows how many total kWh (Energy) were generated at a given power level. That shows how much of the total power generation occurs during the peak output areas even though they don’t represent the largest time segment.
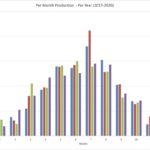
Production by month has a shape you would expect. Almost 7MWh produced in Jul, and less than 1MWh in Jan.
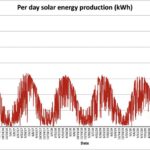
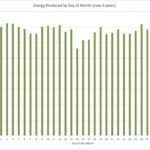
Production by day of the month is just something fun to look at. There isn’t any particular root behind the variance as most of the total solar factors have trends that are not related to particular day number. Of course the dip in day 31 is just due to the uniqueness of the Julian calendar. Solar output is directly correlated to cloud cover, so it would indicated for no discernible reason the 15th of each month was slightly more cloudy on average.
This data is of course specific to a solar system in the Pacific Northwest, and Portland in particular. However is would be representative of a typical system in those conditions, as the southern exposure of this system was very good, clear from obstruction, and consistent over the 4 years.


No doubt most of my friends are aware that I’m a bit of a data enthusiast. You never know when a good dataset will answer some obscure question.
I have been keeping track of my utility usage for all of my adult life, just out of curiosity. (as one does). I recently updated my database with the data from the recent move. I now have 26 years of continuous accurate data about electricity, gas, cable, telecom, water, and garbage spend.
Each graph has a short explanation attached. There are a few interesting tidbits from this cycle – I am at almost $100,000 of spend for electricity over the last 26 years, and sometime in 2022 I should pass over the 1GWH of total electricity usage. Of that 1GWH, 46MWH were solar generated. 1GWH represents the maximum output of a Chernobly reactor for 1 hour as an interesting sidenote. Overall power usage is quite cyclic due to natural gas heat vs electric AC.
My single largest monthly usage is a bit of a fluke at 23.178 Mwh. That is a lot of power for one month, given the average US household use about 10 Mwh per year. The reason was the electric temporary coil heat that was running at the new house to help dry the drywall, which was very inefficient.
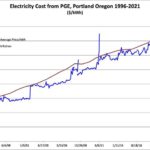
The cost per kWh is an interesting graph, starting at around 6c, and growing to the current 13-14c effective. That price reflects the actual cost of the power I used, including meter fees, etc, so it is a good representation of the practical expense. There is also a graph that factors in the solar power produced, which reduces the effective cost of my power from PGE, but does not take into account the capitol cost.

Hmm. Seems accurate.
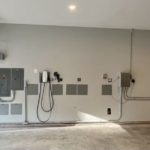
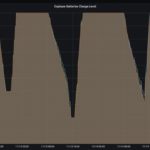

My battery system is now fully functional after a bit of tweaking and testing. There was one battery unit that was behaving a bit odd, and after a full charge it seems to have performed self capacity test (it discharged and recharged). I did three tests setting the lower limits to 40%, 20%, and 30% and it worked well powering all of the house loads.
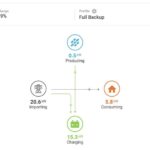
When it is put into full backup mode it can charge the batteries from the grid. In one of the flow charts you can see about a 15kw charge rate, thus charging the 40kwh batteries in about 3 hours.
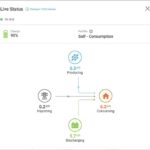
My typical house draw on the ‘generator panels’ is in the 4-5kw continuous, so 8-10 hours of load time. A typical sunny day will net about 120kwh of solar production so more than enough to charge the batteries back to 100%. A cloudy winter day will see much less production, often in the 20-40kwh.
Next up is integration of a generator using the batteries as powerbanks so the genset doesn’t have to run 100% of the time when we are off-grid.


Seems like a good day for fire. I was curious about the heat distribution, so I took a few FLIR pictures. With the window closed but the air draft open this fireplace is very efficient and radiates a surprising amount of heat for an open fireplace.
Of course very dry hardwoods help a bit too.
I have been working on my ‘house audio’ setup. Balancing the zones to get a somewhat even distribution around the 48 speakers and 4 subwoofers.
I have been pretty happy with the HTD zoning setup, and with 36 channels of amp plus the home theater amp it is ~3500 or so watts… and that seems to work well for background fill.
Ceiling speakers suck, so this isn’t a polyphonic masterpiece, but it does work well for music that follows you around.
Video link (Youtube), because Facebook will audio-strike it due to copyrights. Audio is even more mediocre because of an iPhone mic, but at least the sound level is pretty flat as I walk around. The bass is good as the subs really work well on the wood floor and thick floor cavity.
https://youtu.be/MFwKQUBA0oI


Tab A to Slot B.