Browsed by
Month: June 2017

Trash

Trash

As I have been cleaning out my closets, I have collected more data.

The graph below shows how much I paid for garbage pickup since 1996. This is surprising for many reasons. (1) It was surprising to see I had nearly every statement all the way back to 1996. (2) For a while, garbage costs were pretty low and flat and (3) moving to the City of Portland is always the expensive move. 😉

The red line is the actual cost per 96 gallon trash can, and the big jump in 2011 is from both moving into Portland as well as Portland deciding that for the same money they were only going to pickup trash once every other week. You can see the rise in inflation over the same time period, but even taking that into account the overall cost now is higher compared to 20 years ago. Cost for 96 gallons of trash in 1996 = $4.03. Cost for 96 gallons of trash in 2017 (in 1996 dollars) = $12.96. That is a 221% increase.

ISDN

ISDN

For those in the know… this was bad ass home internet in 1997.
[ Sort of the Laserdisc of Internet and Telephony technology ].

At the time I actually had two ISDN lines, each that supported two B-channels. With a little bit of trickery I could connected into our Lucent PRI digital bank and bond all 4 B channels together for 256K up and down.

As a bonus, you could do cool stuff with forged Q.931 headers, as Tony Jones can attest to.

Humid

Humid

So 80 F in Portland right now, 80 F in Bend, and 81 F in Indiana. The difference – 17% humidity in Bend, 37% humidity in Portland, and 74% humidity in Indiana. Oh yea.

Music

Music

Over the last few months I have been working in cleaning up my music library. Lots of terrible meta data, mislabels, imperfect quality, etc. I used a combination of iTunes Match, MusicBranz Picard, fresh CD rips, and a few python scripts to help me get everything in order. It isn’t perfect, but it isn’t bad either.

My Top 10 artists, by number of songs in my collection:

Pink Floyd
Rush
Metallica
Dave Matthews Band
Depeche Mode
The Beatles
The Alan Parsons Project
Peter Gabriel
Led Zeppelin
Andrew Lloyd Webber

Purdue

Purdue

I don’t think at the time I really considered what an incredible deal I was getting. $1260.00 per semester, or $2520 a year, or $10,080 for all 4 years for one of the top 10 engineering schools in the US.

As my friends Thomas Talavage, Mitch Theys, Tim Mattox, Aaron Luft, Mark McDowell, Diane Borgard, Phil Lushin, Nick Jeanfils, Paul Stinemetz, Jon Steckbeck, David S Gardner and many others can attest to.. it was a good return on investment!

SDR

SDR

I excited to play around with a new SDR I got this week. It is a LimeSDR, which was a crowdsourced project. It is similar to the HackRF, but has a bit more bandwidth and a wider usable frequency range. Tunable from 100kHz to 3.8 GHz with 61MhZ bandwidth, so I can decode the entire 10,15,17,20,40 and 80 meter bands at the same time.

It is both transmit and receive, and has 2x RX and 2x TX channels, and enough capacity to do all the usual LTE, GSM, Bluetooth LE, etc.

VE

VE

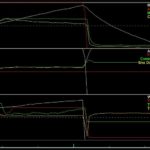
I was looking at a datalog from my drive to work, and it was interesting to see how clearly the VE of the engine is displayed in a graph. If you look at the attached graph the top graph shows manifold pressure in green ( abs psi ), and per cylinder fill (load, g/cyl) in yellow. While the manifold pressure is relatively flat and stable, the per cylinder fill drops as rpm increases.

That load variable is not measured, but calculated from the SD VE table. As a result the value is only useful if the VE table is correct. The correctness (at least relative to other internal values) of the VE table can be approximated by looking at the commanded AFR vs the measured AFR.

The second graph down shows that. The yellow line is the measured AFR, and the green the final commanded AFR. As you can see the VE calibration is pretty good, in part because it is the result of programmatic corrections done after many many drives to and from work. Actual measured AFR is very close to the final commanded AFR. This is also in part due to the excellent fuel injector data provided by ID.

The third graph show the boost control system, which while working well is under duty cycled a bit as it is using the maximum TD Integral. The output is very stable, although a tad lower than the commanded level. (26psi) It is still a pretty flat boost curve for an internal wastegate. I’ll tweak that for the Monday drive.

[NOTE: 08 STI, EFR 8374 Turbo, ID 2000 Injectors, E85 ]

Hillclimb

Hillclimb

Here is a quick in car video from driving at Maryhill Loop Road yesterday.

Data overlay from my Vipec V88. This camera was mounted on the front lip, which is to flexible so very bouncy. I’ll move it to a more hardpoint for the next track day.

This was my first time on Maryhill Loop Road, and it is a fantastic place. Good surface condition and good visibility. Pardon my slow driving as this was more of a fun run event, and of course a new road.

I had a problem with the coupler output from the turbocharger blowing off, so I turned the boost down to 16psi. Next time I’ll get that turned back up to 24!

Thanks to the fantastic Dream Drives folks for an awesome event!

(I added differential fuel pressure and oil pressure, and both look ok. Ideally you want differential fuel pressure to be pretty flat and not drop off at higher load and rpm. I was most curious to see if oil pressure had fluctuations with cornering load. )