Cars


Here is what made the front row cut at dinner this evening… I really love miami blue.
Here is what made the front row cut at dinner this evening… I really love miami blue.


I can’t say I know what W Motor is. Very striking cars for sure.


Walking around Carmel. The Lamborghini is the Mustang of the supercar world. I counted 46 of them just driving from lunch over to Carmel.


A few cars here just for you Eric T. Peterson.


A few cars at lunch…. A DB5, 720C , Veyron, GT2RS….
That DB5 was especially nice.


A few interesting cars that I walked by.. A beautiful pair of 2018 488GTBs, A Portofino (which I had not seen in person before), a Lamborghini Diablo SE30 Jota which is a pretty rare car, and a Porsche Turbo Florio (a RUF built car).
Oh and that Bentley Bentayga is the one that did Pikes Peak a few months back. Lots of Bentleys here, as it was last year.


Audrey is very excited to see the Bagpiper!


A local plane photographer took these two shots last night of the F15s scrambling from PDX as a result of the stolen Q400 in Seattle. (credit to Russell Hill for the amazing pictures – https://twitter.com/Sabian404).
He said the time from initial call to the second plane off the ground was 8 mins. Looks like they were near the other aircraft in another ~6 mins. Lots of reports of supersonic bangs over southern Washington.
I heard them right after take off, as the sound of F15s in full afterburners is distinctive.

I have just reached 2 years of operation of my solar system, so it seems like a good time for a data review.
I produced a total of 20.2MWhs of energy over these 2 years, with a single day peak energy production of 66.8KWh, and a instant peak power production of 9340W ( 240V @ 39 amps ).
Over the entire 2 year cycle that is an average of 28.1kWh produced per day, which is just a tad shy of the average US household use of 30kWh/day.
The attached graphs demonstrate a few interesting observations:
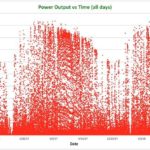
The power vs time of day shows the power produced in 5 min intervals vs the time, and you can see that peak power production occurs between noon and 2pm, with a slight bias towards later in the day for falling power output.
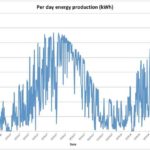
The power output vs time in days shows the obvious seasonal difference. The two more obvious ‘cuts to 0’ in the graph correspond with days where we had significant snowfall here. In the two year period I had 1 day with 0 total power production, and that was due to complete snow cover.
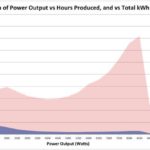
The Histogram of power output is very interesting. The blue represents the number of hours the panels produced within the particular output buckets as seen on the X axis. Obviously the largest bucket is the 0 output (night time). The pink represents the total energy produced during those bucket times. The shape of that curve is indicitive of the type of sunshine exposure we get here in Oregon. Summertime production is very good most days, and most days produce at or near the system limit, while winter days produce very little overall energy.
A typical November – April 6 month span produces 2.5MWh, while a typical May – October 6 month span produces 8MWh. Just June, July and August produces almost 5MWh
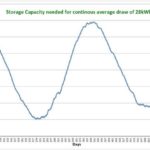
The last graph is a great example of why battery storage is the limiting factor in making stand alone solar really work. That graph shows the amount of energy storage needed to have the solar system provide an even distribution of power over the year. If we assume I have a house that uses exactly the solar system output over the period of a year, you can use this to see what size battery system you would need to have no power outages. It ends up being a tad over 3MWh of storage, which is about 222 Tesla Powerwalls ( With a combined cost of over $1million ). And that assumes I only use the average US household power usage. Storage is a big big problem.
After the tax incentives (both federal and state) the cost of the system was about $27,000. It produced 20MWhs of energy over two years, and my average cost of electricity is around 13 cents/kWh. That is a production of about $2600 of electricity per year, so the payoff would be in a tad over 10 years. Since the price of electricity is going up it will probably net out a tad faster.


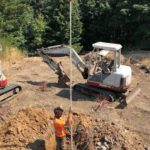
It has begun!
For the curious – the lot we are building on has a set of 48 3 foot diameter concrete and rebar pillars that go 50 feet into the ground each. (Yes, that is a LOT of concrete and drilling). They were put in my the previous land owner as part of his house construction, as it was a house with a 40 foot cantilever design. The house was never started, but the pillars were installed. Some of the tops of the pillars are in the way of some of the footings, so we need to break apart the tops and then cut off the rebar (down a couple of feet) of some of them. That is the work in this video. 1 done, I think 10 more to go.