Solar

I have just reached 2 years of operation of my solar system, so it seems like a good time for a data review.
I produced a total of 20.2MWhs of energy over these 2 years, with a single day peak energy production of 66.8KWh, and a instant peak power production of 9340W ( 240V @ 39 amps ).
Over the entire 2 year cycle that is an average of 28.1kWh produced per day, which is just a tad shy of the average US household use of 30kWh/day.
The attached graphs demonstrate a few interesting observations:
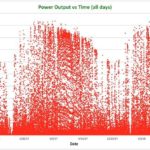
The power vs time of day shows the power produced in 5 min intervals vs the time, and you can see that peak power production occurs between noon and 2pm, with a slight bias towards later in the day for falling power output.
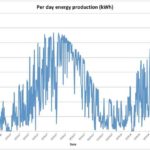
The power output vs time in days shows the obvious seasonal difference. The two more obvious ‘cuts to 0’ in the graph correspond with days where we had significant snowfall here. In the two year period I had 1 day with 0 total power production, and that was due to complete snow cover.
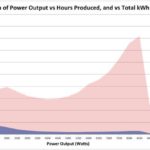
The Histogram of power output is very interesting. The blue represents the number of hours the panels produced within the particular output buckets as seen on the X axis. Obviously the largest bucket is the 0 output (night time). The pink represents the total energy produced during those bucket times. The shape of that curve is indicitive of the type of sunshine exposure we get here in Oregon. Summertime production is very good most days, and most days produce at or near the system limit, while winter days produce very little overall energy.
A typical November – April 6 month span produces 2.5MWh, while a typical May – October 6 month span produces 8MWh. Just June, July and August produces almost 5MWh
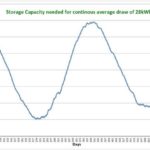
The last graph is a great example of why battery storage is the limiting factor in making stand alone solar really work. That graph shows the amount of energy storage needed to have the solar system provide an even distribution of power over the year. If we assume I have a house that uses exactly the solar system output over the period of a year, you can use this to see what size battery system you would need to have no power outages. It ends up being a tad over 3MWh of storage, which is about 222 Tesla Powerwalls ( With a combined cost of over $1million ). And that assumes I only use the average US household power usage. Storage is a big big problem.
After the tax incentives (both federal and state) the cost of the system was about $27,000. It produced 20MWhs of energy over two years, and my average cost of electricity is around 13 cents/kWh. That is a production of about $2600 of electricity per year, so the payoff would be in a tad over 10 years. Since the price of electricity is going up it will probably net out a tad faster.