Browsed by
Category: Uncategorized

Purdue

Purdue

I don’t think at the time I really considered what an incredible deal I was getting. $1260.00 per semester, or $2520 a year, or $10,080 for all 4 years for one of the top 10 engineering schools in the US.

As my friends Thomas Talavage, Mitch Theys, Tim Mattox, Aaron Luft, Mark McDowell, Diane Borgard, Phil Lushin, Nick Jeanfils, Paul Stinemetz, Jon Steckbeck, David S Gardner and many others can attest to.. it was a good return on investment!

SDR

SDR

I excited to play around with a new SDR I got this week. It is a LimeSDR, which was a crowdsourced project. It is similar to the HackRF, but has a bit more bandwidth and a wider usable frequency range. Tunable from 100kHz to 3.8 GHz with 61MhZ bandwidth, so I can decode the entire 10,15,17,20,40 and 80 meter bands at the same time.

It is both transmit and receive, and has 2x RX and 2x TX channels, and enough capacity to do all the usual LTE, GSM, Bluetooth LE, etc.

VE

VE

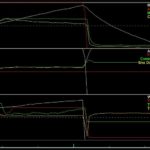
I was looking at a datalog from my drive to work, and it was interesting to see how clearly the VE of the engine is displayed in a graph. If you look at the attached graph the top graph shows manifold pressure in green ( abs psi ), and per cylinder fill (load, g/cyl) in yellow. While the manifold pressure is relatively flat and stable, the per cylinder fill drops as rpm increases.

That load variable is not measured, but calculated from the SD VE table. As a result the value is only useful if the VE table is correct. The correctness (at least relative to other internal values) of the VE table can be approximated by looking at the commanded AFR vs the measured AFR.

The second graph down shows that. The yellow line is the measured AFR, and the green the final commanded AFR. As you can see the VE calibration is pretty good, in part because it is the result of programmatic corrections done after many many drives to and from work. Actual measured AFR is very close to the final commanded AFR. This is also in part due to the excellent fuel injector data provided by ID.

The third graph show the boost control system, which while working well is under duty cycled a bit as it is using the maximum TD Integral. The output is very stable, although a tad lower than the commanded level. (26psi) It is still a pretty flat boost curve for an internal wastegate. I’ll tweak that for the Monday drive.

[NOTE: 08 STI, EFR 8374 Turbo, ID 2000 Injectors, E85 ]

Hillclimb

Hillclimb

Here is a quick in car video from driving at Maryhill Loop Road yesterday.

Data overlay from my Vipec V88. This camera was mounted on the front lip, which is to flexible so very bouncy. I’ll move it to a more hardpoint for the next track day.

This was my first time on Maryhill Loop Road, and it is a fantastic place. Good surface condition and good visibility. Pardon my slow driving as this was more of a fun run event, and of course a new road.

I had a problem with the coupler output from the turbocharger blowing off, so I turned the boost down to 16psi. Next time I’ll get that turned back up to 24!

Thanks to the fantastic Dream Drives folks for an awesome event!

(I added differential fuel pressure and oil pressure, and both look ok. Ideally you want differential fuel pressure to be pretty flat and not drop off at higher load and rpm. I was most curious to see if oil pressure had fluctuations with cornering load. )

Radiation

Radiation

Being a data nerd, I have been collecting some data while flying around. I was curious to see the effect of both altitude and latitude on background radiation level. This is well known stuff, but it is always reassuring to do your own measurements and see the effect of physics at work.

The first chart is from flying down to Pebble Beach today, cruising at ~41,800feet. It is a set of collections of altitude and measured radiation level in uSv/hr. Background radiation level in Portland is right around 0.10uSv/hr, a tad under the national average.

You can see the profile of radiation level correlates well to altitude. Peak measurement on this trip was 3.41uSv/hr, or a bit over 34 times regular background radiation. Indeed the atmosphere makes a big difference!

It is hard to detect, but if you average the data there is a slight downward trend at the same altitude as we fly south.

The second graph is from a flight earlier this year flying home from Hawaii at 42,500 feet. All of these datapoints are from the same altitude, the slope of the curve is entirely caused by the change in latitude. As we go north, we move into the thinner parts of the Van Allen belts and as a result the radiation at altitude is higher.

Science, it works!

Stickers

Stickers

Speaking of driving the Subaru. For years I was sporting a Spec C RA badge from when I had a Spec C RA drivetrain in the car. Since switching to the Flat 6 I have been in serious poserville. I corrected that today as well.

I suspect people who know WRXs will look at it and think I am even more of a poser. Little do they know!

WRX

WRX

A good day to drive the old Subie to work on RA1s. 😉

Seats

Seats

Well, I got the new seats and harness installed. Drivers seat is a tad tall, so I may build a custom bracket so I can lower it and move it back a bit. The harnesses are attached at the back with a slight downward angle, but are within the harness specifications.

I also installed a remote kill switch since the battery is in the trunk area. I think this is the first time I have ever removed the rear bumper cover (in 15 years). Installation was straightforward, but I still need to run the wires to the front for the ignition disconnect.

Yard

Yard

Playing in the yard…