Water

So… time for the next utility history plots! Water! Since we live in Portland, water isn’t exactly a scarce resource. Most of our power comes from it, and we get an ample supply 9 cloudy months of the year.
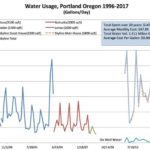
However paying for water is an interesting exercise. As with my previous graphs, this data encapsulates all of the water I have paid for since 1996. There is one empty spot in the chart where I lived in the country and had well water.
A couple of interesting things of note: I used 1.511 million gallons of water in this 20 year period. That is a tad over 3 full size olympic swimming pools. In that period I paid almost $15,000 for the privilege.
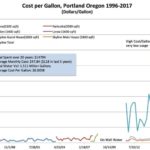
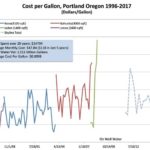
In looking closely at the bills, the actual amount of water had very little impact on the cost. In most cases the fixed cost of sewer and stormwater management , bike lanes, and political kickbacks was more that the variable cost of the water itself. I had one bill for $218 to cover 374 gallons of water, while at the same time another bill for $238 for 30,000 gallons of water!
Over the entire history water was a tad less than 1 cent per gallon, but in the last 5 years that price has risen to almost 1.5 cents per gallon.
All in all, water is still pretty cheap.