VE
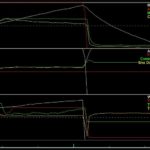
I was looking at a datalog from my drive to work, and it was interesting to see how clearly the VE of the engine is displayed in a graph. If you look at the attached graph the top graph shows manifold pressure in green ( abs psi ), and per cylinder fill (load, g/cyl) in yellow. While the manifold pressure is relatively flat and stable, the per cylinder fill drops as rpm increases.
That load variable is not measured, but calculated from the SD VE table. As a result the value is only useful if the VE table is correct. The correctness (at least relative to other internal values) of the VE table can be approximated by looking at the commanded AFR vs the measured AFR.
The second graph down shows that. The yellow line is the measured AFR, and the green the final commanded AFR. As you can see the VE calibration is pretty good, in part because it is the result of programmatic corrections done after many many drives to and from work. Actual measured AFR is very close to the final commanded AFR. This is also in part due to the excellent fuel injector data provided by ID.
The third graph show the boost control system, which while working well is under duty cycled a bit as it is using the maximum TD Integral. The output is very stable, although a tad lower than the commanded level. (26psi) It is still a pretty flat boost curve for an internal wastegate. I’ll tweak that for the Monday drive.
[NOTE: 08 STI, EFR 8374 Turbo, ID 2000 Injectors, E85 ]

